Google analytics is a free tool that lets you monitor the traffic coming in and out of your website.
Setting up Google Analytics
To begin using a Google Analytics account you need to first create a Gmail account. After you've created this head to https://analytics.google.com/ and log in with your Gmail address.
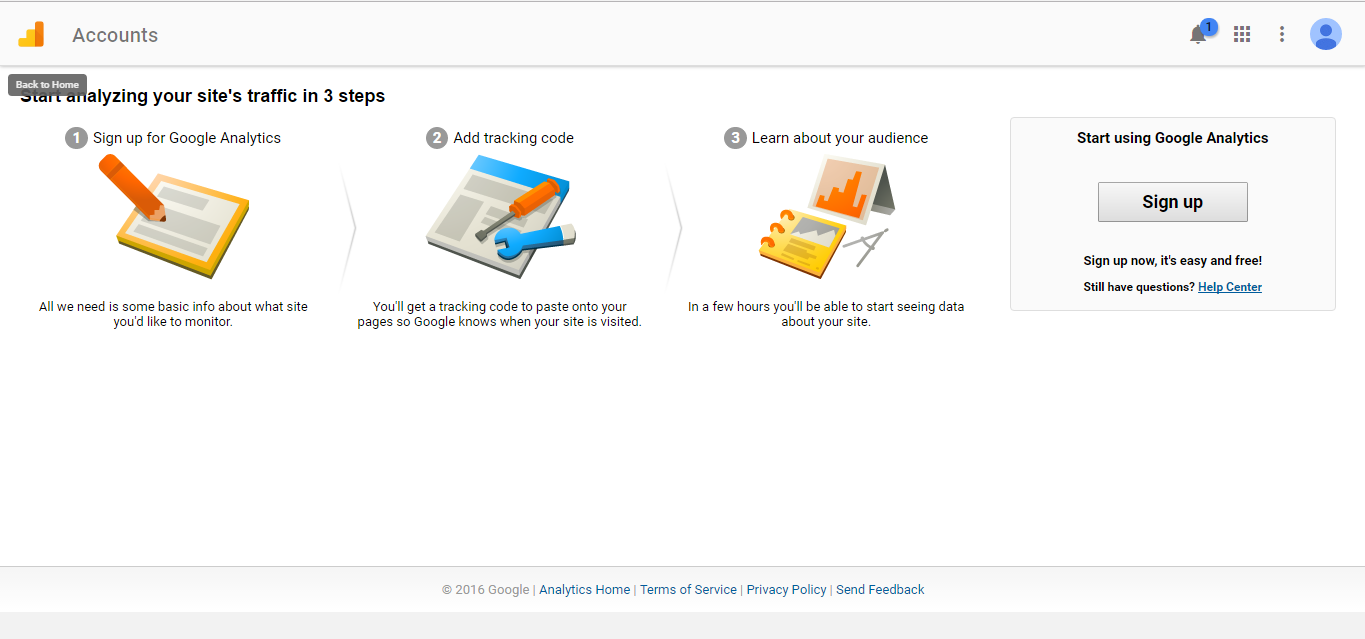
Once you sign in you'll see the page displayed above with a "sign up" button on the right-hand side. Click on the button and the process will 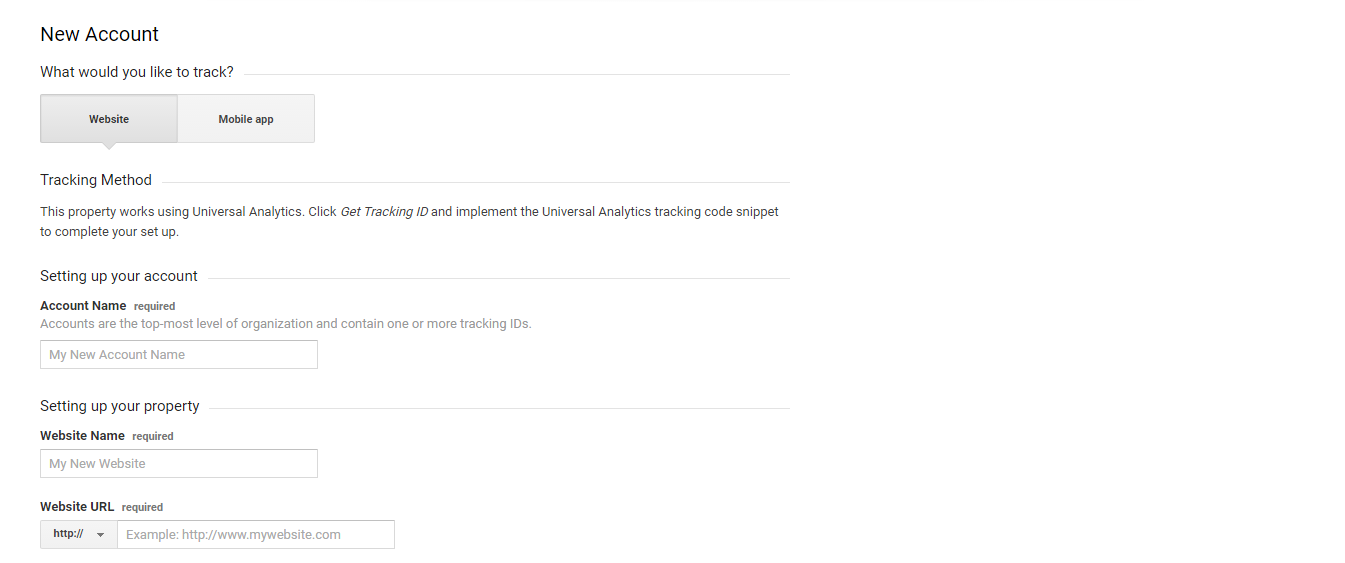 begin. The set up of Google analytics is pretty straight forward, above is the list of details that you need to fill out:
Account Name - This is the name of the analytics account which you can call whatever you like, things such as the company name or an abbreviation is a good idea.
Website Name - This is just simply the name of the website, not the URL.
Website URL - You don't have to include the "http://" just the basic URL.
Industry Category - Select the category that your website represents the best. This won't change the way your data is collected but it will help google try and customise the way the report will look to you.
Reporting Time Zone - Choose the timezone that your business is operating in. Once you've filled out all of the details click "Get Tracking ID" to finish.
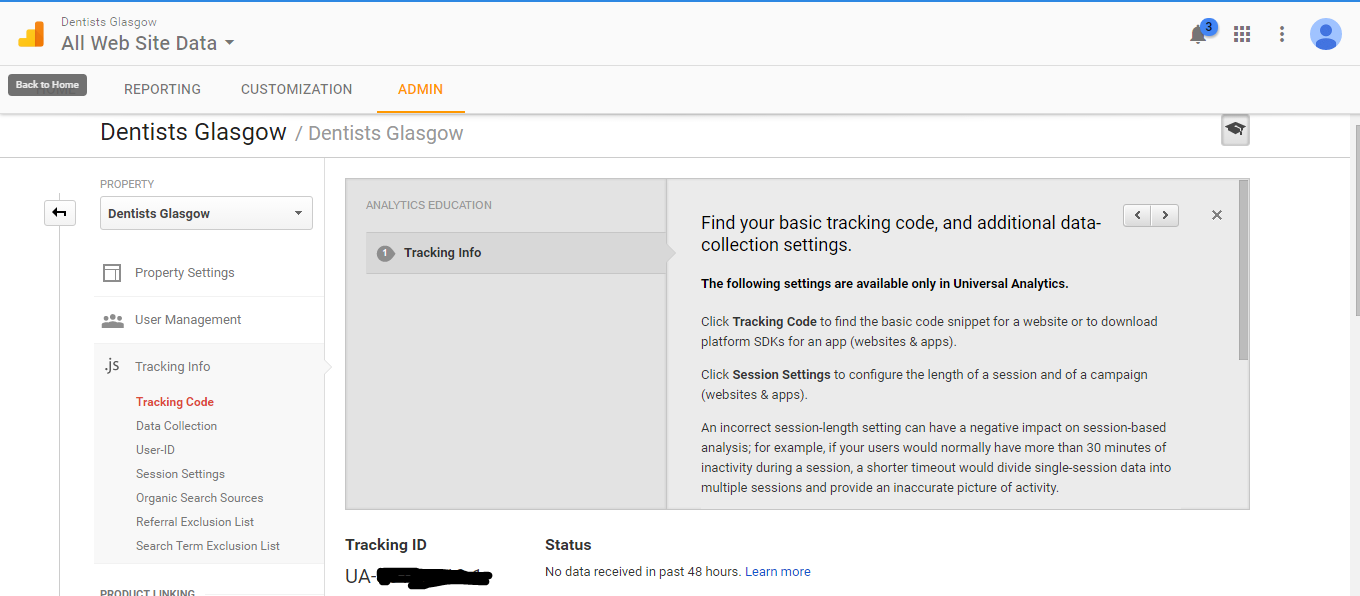 Now everything is from this end is set up it's time to add the UA(Universal Analytics code) to your website. The platform I'm using is WordPress which makes this a quick and easy. To add this code you first need to download one of the various Google analytics plugin available.
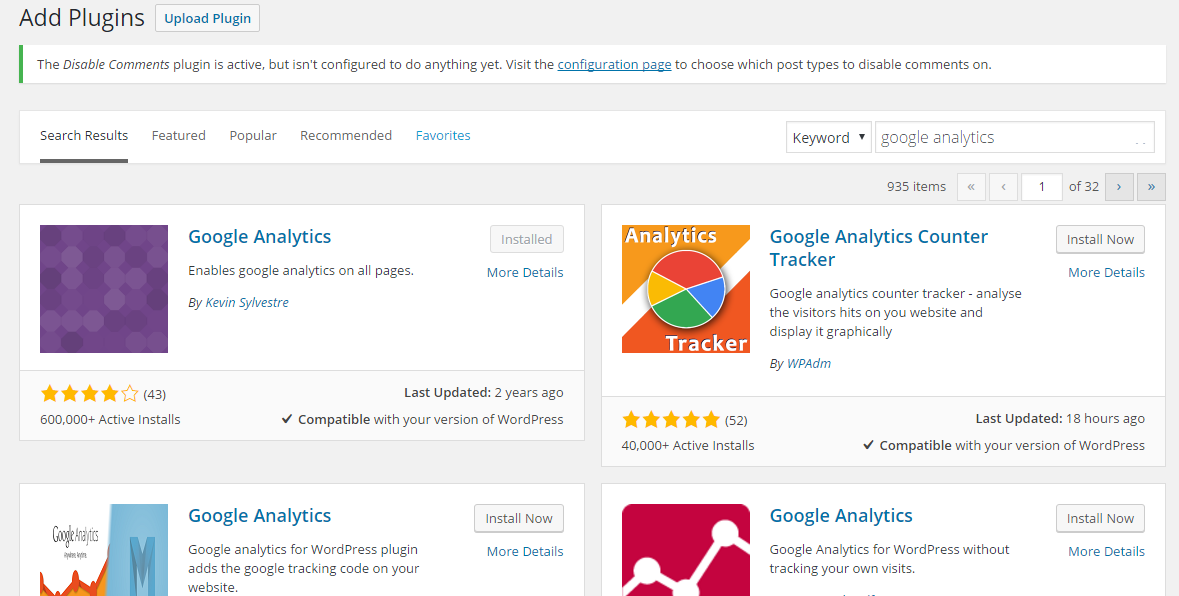
The one I always recommend using is the "Insert Headers and footers" plugin, head back to your Google analytics account and copy the tracking code from the main dashboard. Then go to your analytics plugin page like the one below and paste the code into the "web property ID".
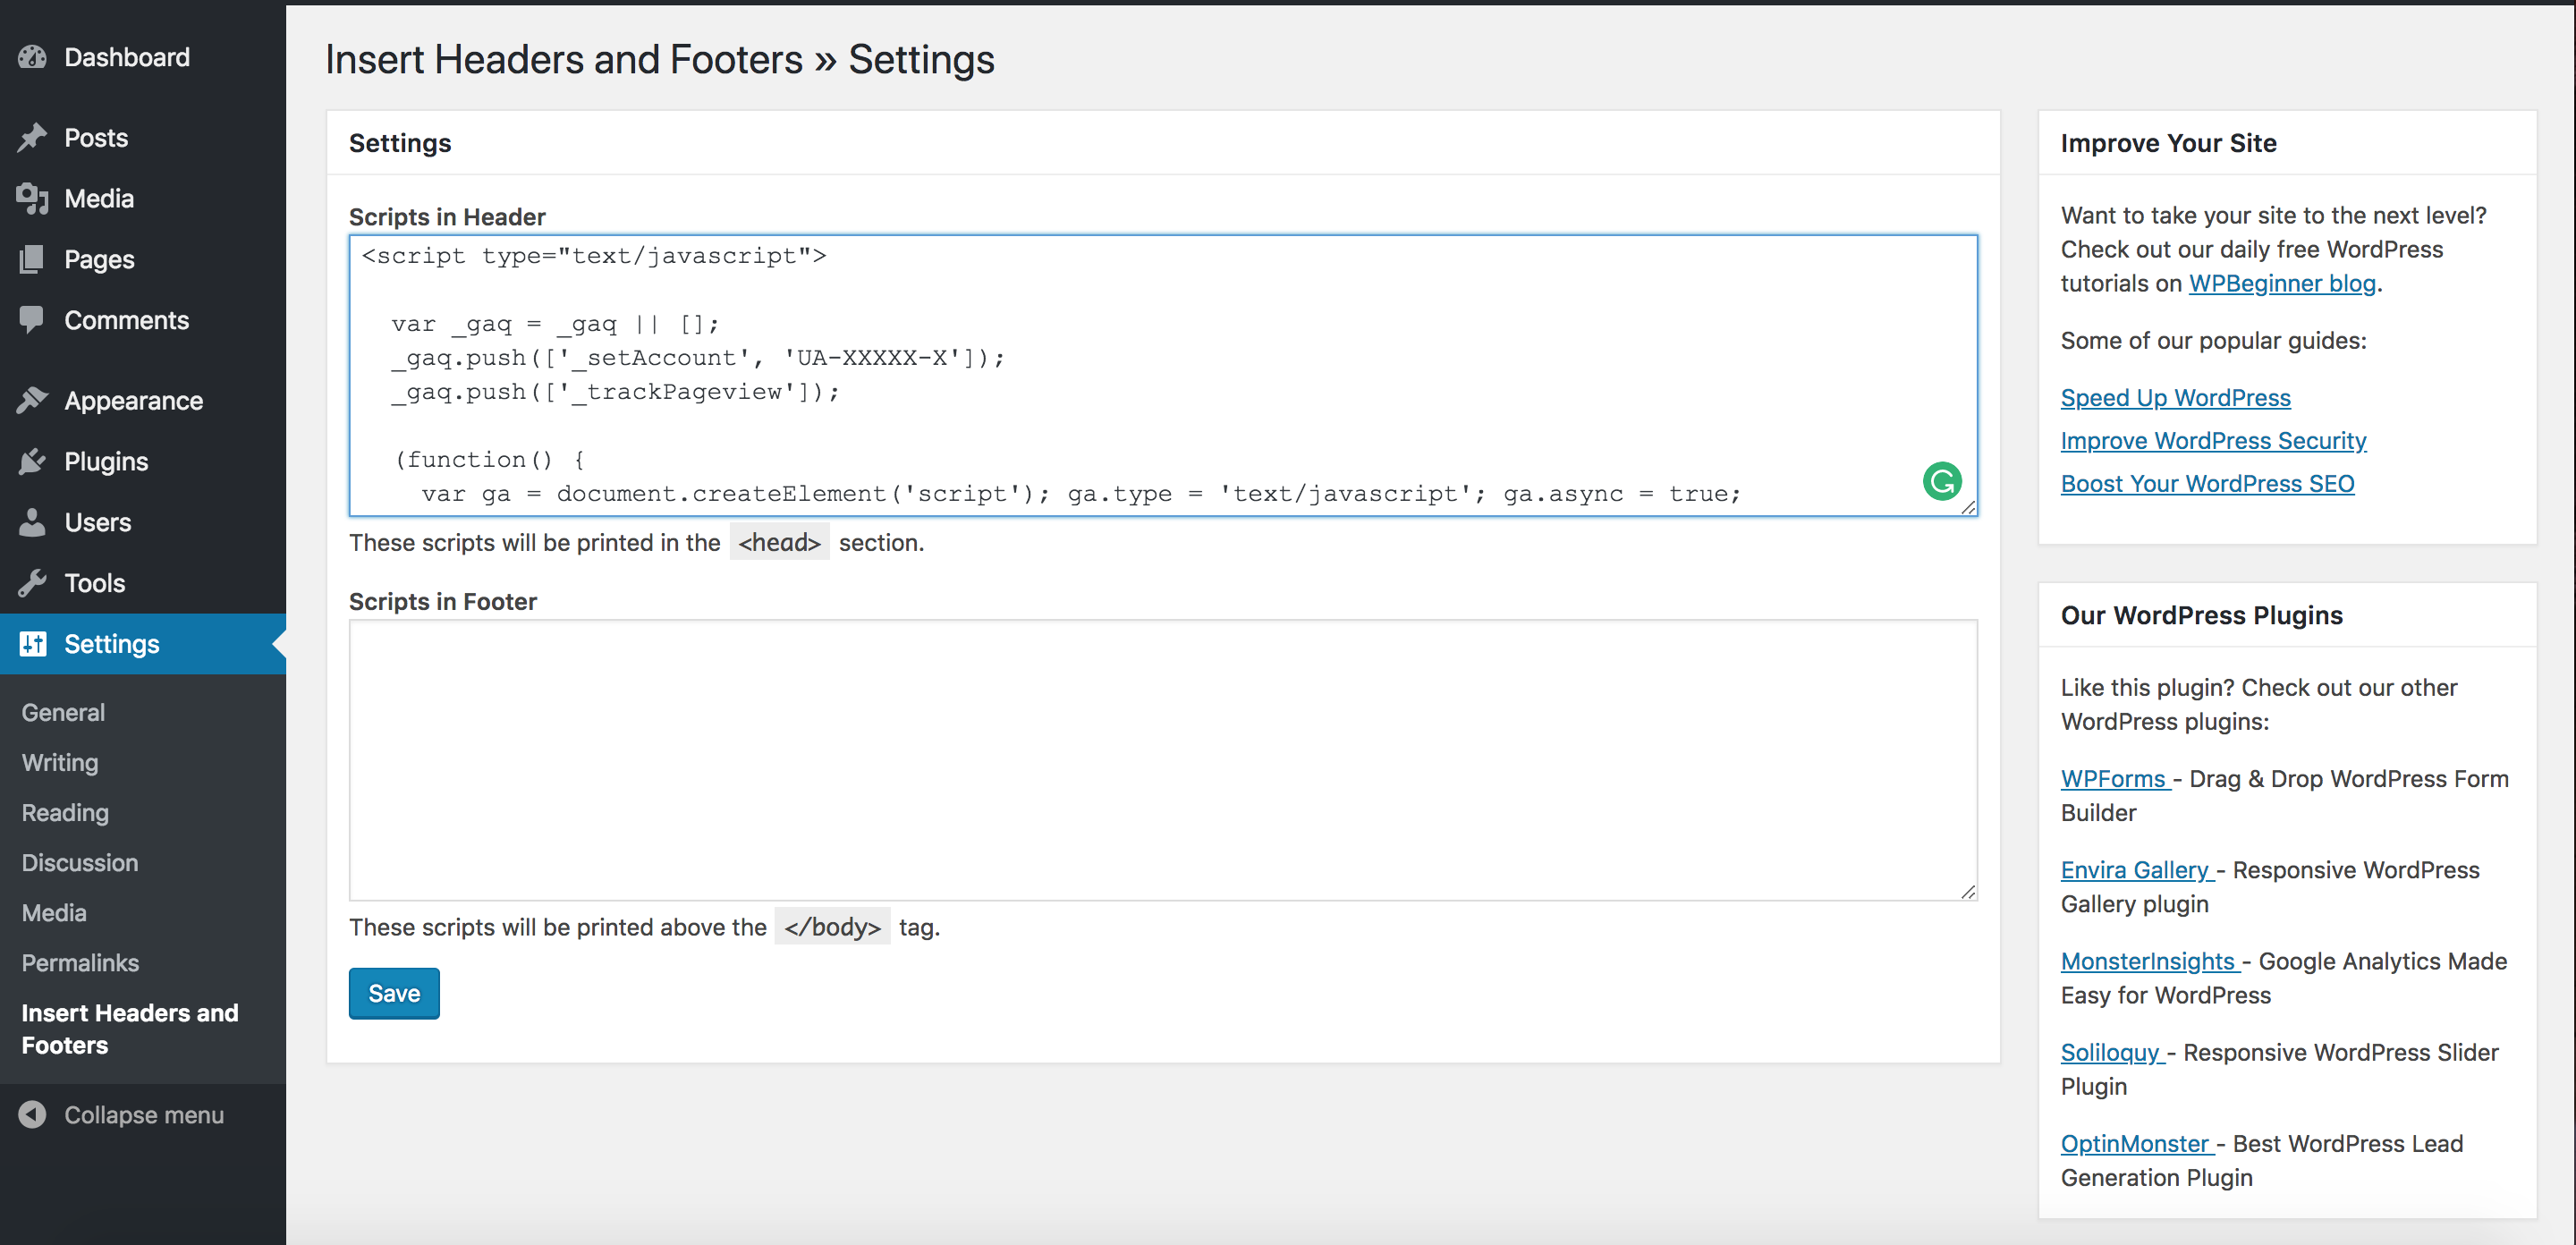
That's all there is to it!, your site has now been linked to your Google analytics account which will now begin gathering data from this point forward.
2. Audience
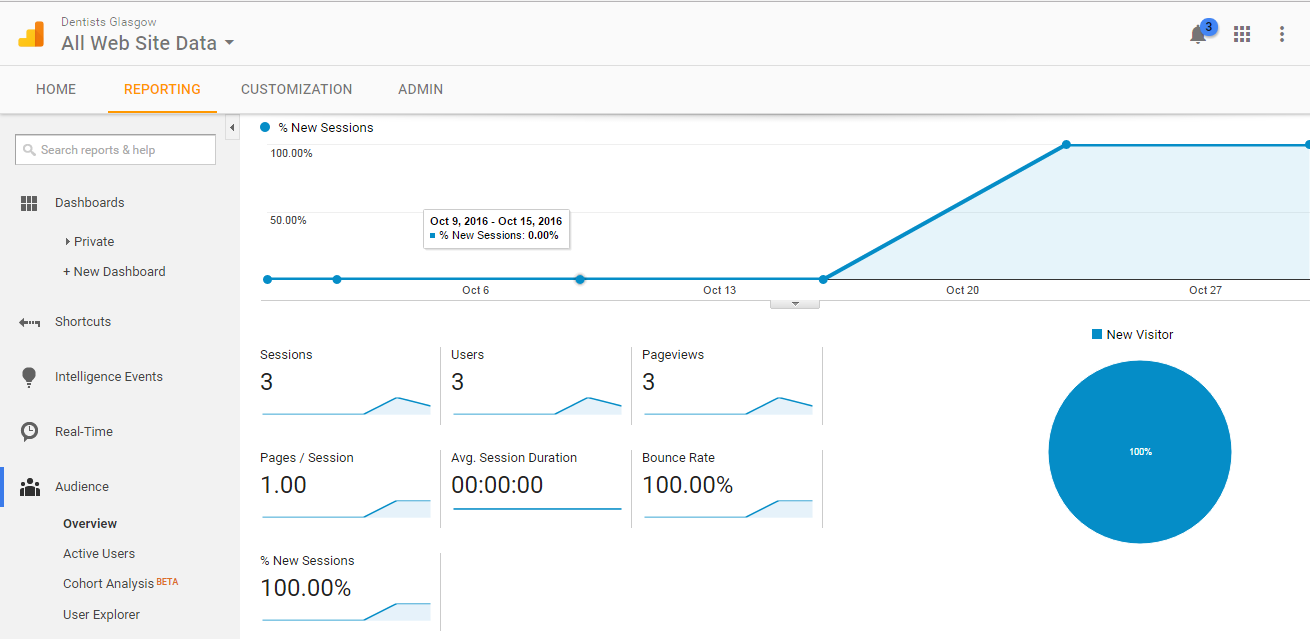
Once you login to your analytics account you will be taken into the audience overview section of the account. You can have a look at the dashboard section that you will find in dashboards --> private --> my dashboard. Here you will see a complete overview of your analytics account that the audience section will go into in more detail.
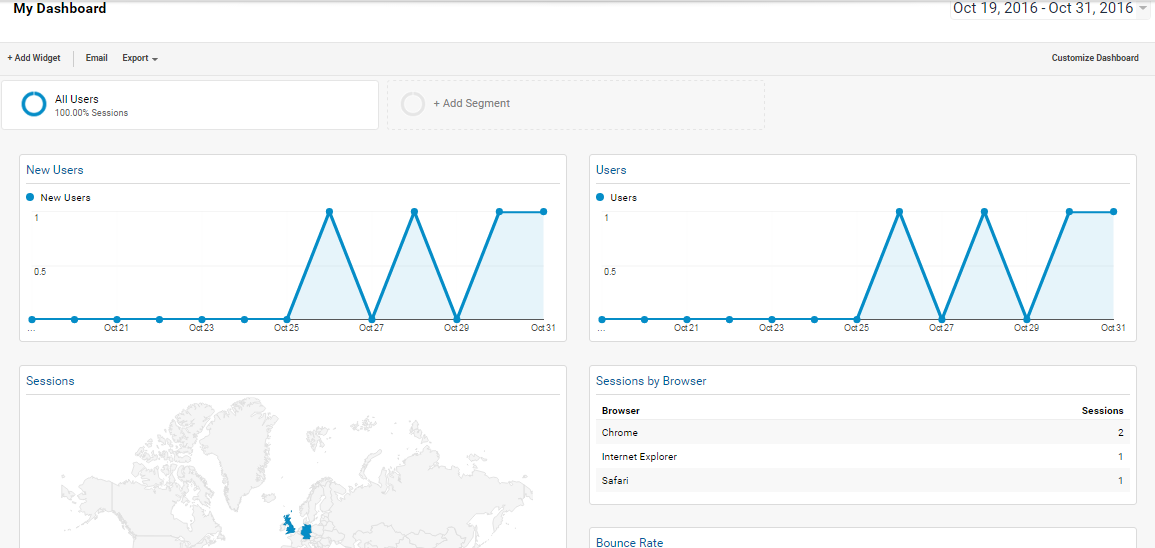 Above is the general dashboard that you will see in every analytics account, it summarises everything in the audience area of the analytics account from the number of users that entered the site to the locations that they are coming from. This site has just recently been put live with analytics set up in the past week and is slowly beginning to show the user sessions. Now we'll head to the audience section of analytics. There a plethora of data for you to have a look at and individual features that have a great way for you to make the most of an analytics account.
 The dashboard of your google analytics account will show you a basic overview of the information of traffic on your site such as the number of sessions that took place(people visited the website).
Metrics
Before you can effectively use analytics you need to understand each of the metrics and how you can use the information to better tailor your campaign. Google analytics will break up each of the metrics into 3 separate categories - Acquisition, Behavior, Conversions. Acquisition
- Session - Shows you the number of sessions your site has had old and new.
- % New Sessions - This is the percentage of first-time visits from users
- Avg. Sessions Duration - This is an average of how long each of the sessions lasted
Behaviour
- Bounce Rate - This is when a user clicked on a page on your site and never progressed any further before leaving.
- Pages/sessions - This is the average amount of pages of your site a user visits per single sessions.
- Pageviews - This is the overall pages viewed throughout your site by all users. Even returning to a previously viewed page will count as a new pageview.
- avg. Session Duration - This will take an average time that users have spent on your site from each of your sessions.
Conversions
- Goal conversion rate - Shows you the percentage of overall users that visited your site divided by the number of conversions.
- Goal completions - The total amount of conversions that your site has had
- Goal Value - The total value gained from all of your conversions.
Active Users
This section displays the amount of users that are actually on your site in as early as that day. You have the option to display users that visited your site within the last day, 7 days, 14 days or 30 days.
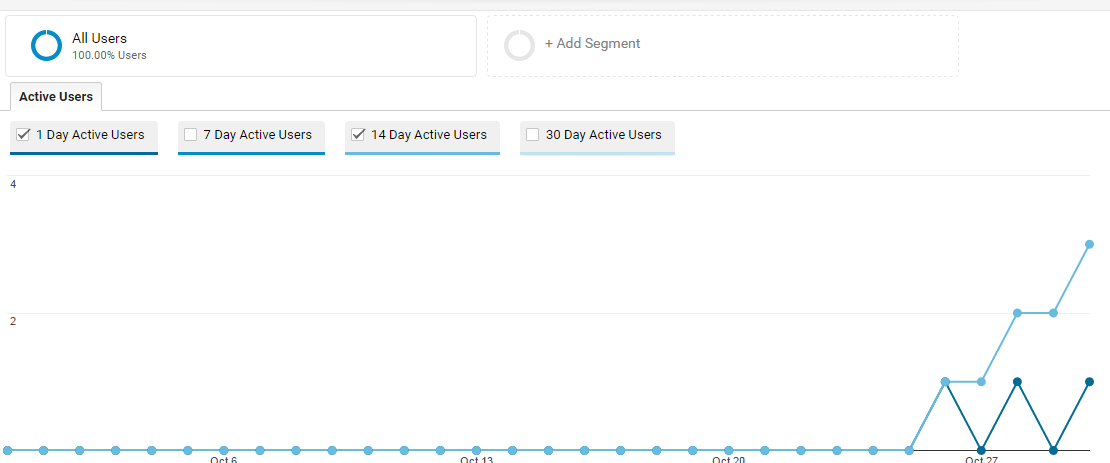
This is a great way to narrow down areas that your traffic may have spiked or decreased. If you find that within the last two weeks for example that the number of users has dropped significantly from the weeks before then you may want to have a look at your site and see what may be causing the issue.
User Explorer
The user explorer tab will allow you to have a look at each individual user and find out how they acted and what actions they completed on your site. If your site has e-commerce functionality, you can also see how many times a user has purchased something from your store as well as the total amount spent.
Demographics and Interests
This section of analytics breaks down each of the different demographics entering your site. Age, gender and interests are a great way of understanding how all demographics are interacting with your site and if you are reaching your intended audience.
Overview - This shows you the overview of the age and gender demographics split into sessions, you can compare this with the multiple other metrics that google analytics tracks.
Age - This will show you all of the relative metrics for each of the age ranges. The age range starts at the age of 18-24 and it increases in blocks of 9 until the 65+ range.
Gender - Again the same as age it will show you the metrics between the two gender types male-female. In-Market Segments - This is the users that are considered closer to buying from your site.

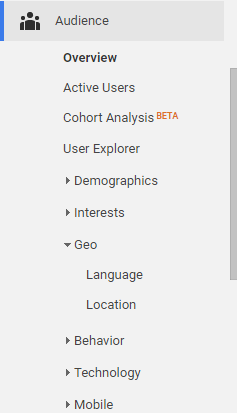
GEO
This is where you can see how your site is performing in certain locations (cities and regions etc.), you can then set up a campaign to begin targeting these areas more effectively. As you can see above you get quite a nice infographic to help you understand how your site's traffic with plenty of different filters on the top left-hand side. All of the relevant acquisition, behaviour and conversion metrics are shown here, to know which of the areas are performing the best make sure to look in the "E-commerce" tab.
Behaviour
This section allows you to understand how your users behave on your site. The returning vs new users section compares the metrics of both user types giving you a good interpretation of your customers. Typically you will find that your returning customers will have a better conversion rate and a lower bounce rate than the first time users. Depending on how your site is performing you will know which type is working for you better and what one you may need to target more. The frequency & recency section is what you can use to find out how often users are visiting your site and the nature of how they visit. You can check both the "count of sessions" and "days since last session".
Count of sessions - This will display the number of users that entered your site multiple times without clearing their cookies. The count of sessions tab will number from 1,2,3,4 and so on until 9 where it will then begin to group the numbers together (9-15 etc.)
Days since last session - Here you can see the number of days it has been since someone last entered your site. The number of days will again increase in 1's just like the sessions counted. You can compare each of these metrics hand in hand to get a proper representation of how users are interacting with your site. Engagement is where you can view how long a session has lasted on your site and you can see how many pages the user browsed through. Just like the other reports it gives you brackets in seconds that the users fall under.
Along with this, you will see the number of pages that have been visited by these users. What you will find is that the users in the lowest 1-10 bracket will have a very similar ratio in pages depth to session duration. This makes sense as someone who entered your site for less than 10 seconds will most likely have just left your site immediately. As the time increases the pages should also. This information is extremely useful in finding out the best way to get your customers to spend less time and spend more money. For example, you will find that people who spend more money will take longer to make a purchase than those spending less. A number of factors could contribute to this such as buying more than 1 product etc. Looking at this data you will be able to see if the amount of time spent could be potentially decreased for the user with things like easier access to additional purchases or not as many pages to scroll through.
Technology
In here gives you some insight into what the users are using to visit your website. The browser & OS section gives the list of total sessions and breaks them down into several browser types such as google chrome, safari, internet explorer etc. Here is a list of metrics it tracks:
- Browser - This is the browser that the devices use such as google chrome, safari, internet explorer etc.
- OS (Operating System) - The two main operating system is windows (windows) and iOS(Mac).
- Screen resolution - Shows the screen resolution of the device used to view your site. This is a good way to understand how many users are using a mobile device.
- Screen Colours - The colour depth that the device used is capable of.
- Flash Version - The flash player version used by the user.
- Java support - Displays the users that have java support on their browser and ones that don't.
- Network - Gives you a list of Internet service providers that people are using.
These metrics are a good way of showing how important these factors are. If you find that your users are coming from lots of different browsers, then you need to make sure that your site performs the way it should across all of them. You might find that not many people have java support with their device, so you might want to avoid using any complicated java scripts throughout your site. Consider all of these factors when reading through this information and tailor your site to suit the needs of your users.
Mobile
The amount of people that use phones and tablets is always increasing which is why google analytics provide you with this section. In here is where you can see all the sessions split into desktop and mobile, you can then compare this with the other metrics to find out which device is working better for you. (The bounce rate metric on mobile devices will most likely be higher than desktop due to the nature of the medium. People are generally a lot more impatient being on the move etc.) In the devices section you will find even more data for you to look at, below is a list of the dimensions:
- Mobile device info - Here is where you'll find the make and model of the mobile devices used. For example "Apple iPhone" and "Sony Xperia".
- Mobile Device Branding - This will separate the results by device manufacturer e.g Apple, HTC, Nokia
- Service Provider - The user's internet service provider(ISP).
- Mobile Input Selector - The technology that the mobile device uses. You will find that most will people use touchscreen in mode section.
- Operating System - This is the software that the device is running on. For example "iOS" or "Android".
- Screen Resolution - This shows the resolution of the device that is being used. From here you can determine whether it is a tablet or phone by the user.
3. Acquisition
This tab is where you can see all data related to sessions themselves. Everything from site traffic to the campaigns can be viewed from this section.
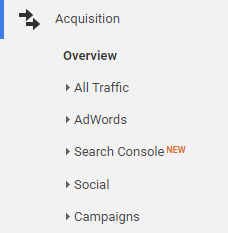
All Traffic
The channel area shows you where your traffic is coming from, the are a few avenues for people to find your site that is google analytics can track. (Pay per click is another method you can use which is managed with an ad words account.) The first is direct traffic, this means that someone has typed your web address directly into a search bar and entered the site this way.
The second is organic traffic, this is when a user has clicked on one of your google listings using the search engine. This can be any page on your website that Google has indexed and this is the most popular way for someone to find your site online.
Third is referral traffic which is when someone has landed on your site using something other than googles search engine. A way to look at this is a recommendation If another site out there has a hyperlink to your website, then anyone that clicks on that will be marked as referral traffic.
You also have Social traffic which is any kind of traffic gained through popular social media sites such as Facebook and Twitter. The source/medium section shows you in more detail where the traffic has actually come from. Below is what the different sources will look like: (direct)/(none) Google/ Organic www.examplewebsite.co.uk/Referral Comparing these with the other metrics on Google Analytics will allow you to see where most of your traffic is coming from and where your traffic is lower in some areas so you can begin to target these more. The referral traffic section goes more in depth with each of the referring domains. You can see the landing page of each of the links and what kind of traffic they have. If you click on some of the domains you might be able to see the page that your site has been referred on, this can be quite useful to make sure that the pages are relevant for your site to appear on.
Customisation
This area is where you can create our own custom reports. This is quite helpful if there are certain metrics that you wish to compare and it gives you a graphical representation you're happy with. If you are gathering information to show someone this is a great way to tailor the report's data for easier management.
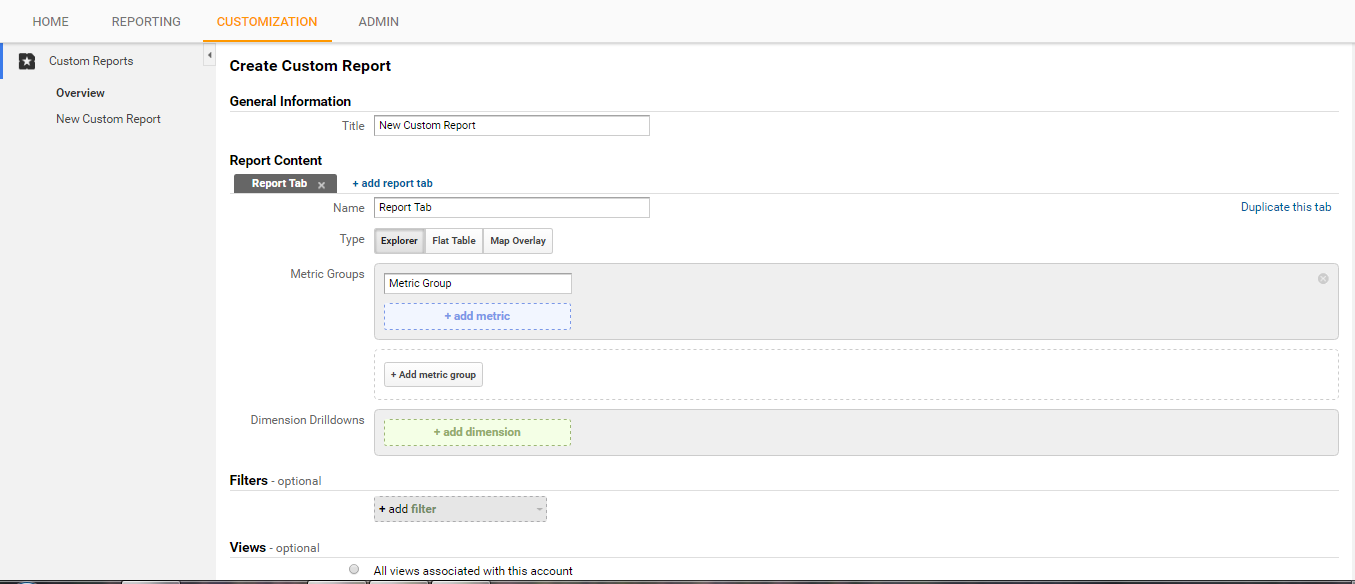
The picture above shows you how to set up your custom report following these few steps: General Information
- Title - This is the main title of your report. You can name this whatever you'd like.
- Name - This is the name of the report, you can have multiple report tabs all under one big report file.
- Type - This allows you to select the type of report it will be. There are 3 selections to choose from explorer, flat table and map overlay.
- Metric Group - Choose from any of the metrics that google analytics track and create multiple groups to work from.
- Dimension drilldowns - You can select one of the dimensions that analytics provide and any others added will appear in a separate tab making your report easier to organise. (I recommend you use the flat table report when working with multiple dimensions. It is easier to view all of the information as you don't have to navigate through lots of pages)
- Filters - You can remove certain metrics and dimensions with this option to fully tailor a report to what you want.
- Views - From here you can choose where this report can be viewed from. You can choose manually select the specific sites or have it display on all views.
Admin
Here is where you will find all of the settings relating to your account.
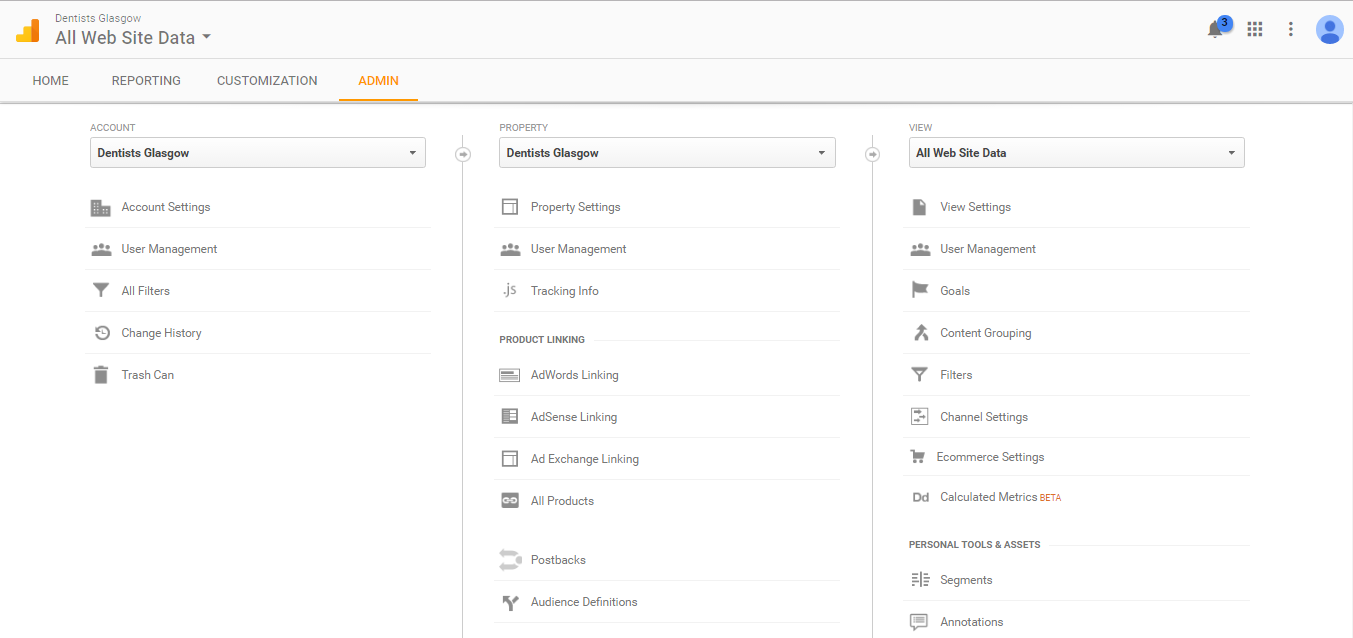 Above is all of the settings relating to your account. I will go over a few here that you may want to look at: User Management - This area is where you can select people you want to give access to your analytics account.
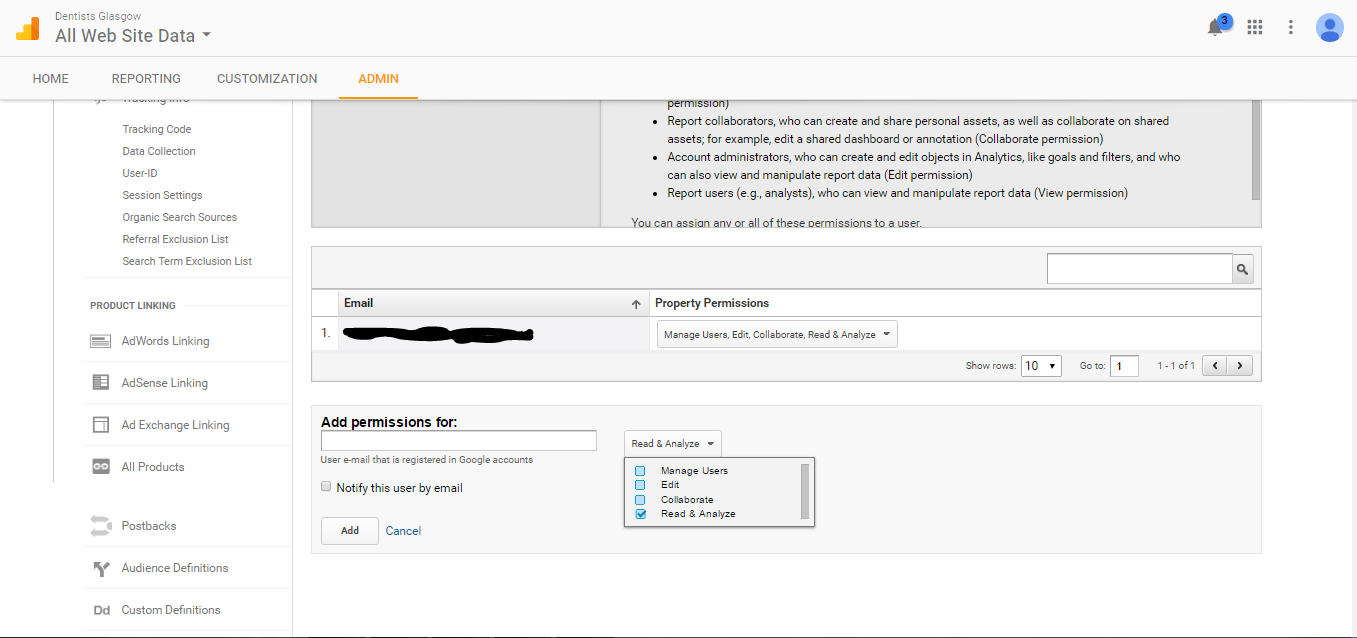 For someone to access the account all they need is an email address. Then the next part is simple all you need to do is give access and then assign them the available permissions.
Product Linking - You can link your analytics account with the other services that Google provides such as AdWords or AdSense. This will allow you see the data from multiple services all in the one area making it a lot easier than navigating through every tool.
Social settings - Here you can add any of your social channels to view its data. If for example, you have a Youtube channel, you can add it to this area to see the activity on your analytics.

Add Filter - You can add specific filters to your analytics, so you can tailor your report to suit you.
Overview
Google analytics is the best free option for tracking your website. Placing a tracking code on your website allows google to get really specific with your website's data, having this kind of information allows you to improve your sites traffic, conversions etc massively. Not only is it great for tracking your own website's progress it is also a great tool for your clients. Letting them see what the kind of progress their website can make your job a whole lot easier, on top of this you can send out reports to clients very easily from google analytics.
I would highly recommend you set up a google analytics code with every SEO campaign you start. The next thing you should look to set up is the Google Search Console.